A model can be accurate on average and still miss the condition more often in one group of patients. Fairness evaluation makes such differences visible before the tool is used on those patients.
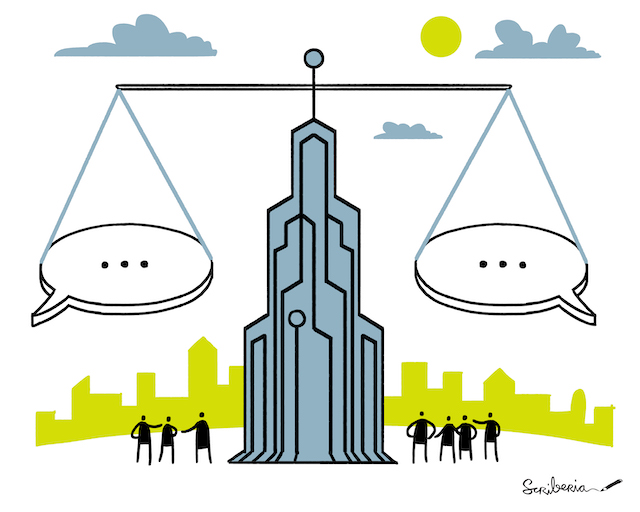
Figure 1:The Turing Way Community. This illustration is created by Scriberia with The Turing Way community, used under a CC-BY 4.0 licence. DOI: 10.5281/zenodo.3332807.
Why average performance hides disparities
Suppose 90% of your test set comes from one group and 10% from another. A model that works well for the first group and poorly for the second can still reach a high overall score, because the second group barely moves the average. You only see the problem if you report performance separately for each group (disaggregated reporting).
Defining fairness
There are several mathematical definitions of fairness, and in most real datasets you cannot meet all of them at once.
| Fairness criterion | Definition |
|---|---|
| Statistical (demographic) parity | Equal rates of positive predictions across groups. The statistical parity difference is the positive prediction rate in group A minus the rate in group B. |
| Equal opportunity | Equal true positive rates (sensitivity) across groups |
| Equalised odds | Equal true positive rates and equal false positive rates across groups |
| Calibration within groups | Predicted risks match observed outcomes in each group |
| Individual fairness | Similar patients receive similar predictions |
In clinical use, equal opportunity and equalised odds are usually the most relevant. If a screening tool misses disease more often in one group, those patients are harmed. Statistical parity is less useful when the condition is more common in some groups than others, because a correct model should then flag those groups more often. Choose your criterion for clinical reasons and write down why.
Subgroups to analyse
List the subgroups in your evaluation plan before you open the test set. Which attributes matter depends on the application. Common choices are age group, sex and gender, ethnicity (where recorded, keeping in mind that recorded ethnicity is often incomplete or inaccurate), socioeconomic position (for example through postcode), disease severity or subtype, and site or equipment. In the Netherlands, ethnicity is rarely recorded in clinical data. If you need it to check for bias, the EU AI Act allows providers of high-risk AI systems to process such special category data for that purpose, under strict safeguards (Art. 10(5)) European Parliament and Council (2024); involve your data protection officer.
Measuring performance disparities
Calculate your primary metrics separately for each subgroup and report:
the estimate for each subgroup;
confidence intervals, which will be wide when subgroups are small;
the difference between groups, with its uncertainty;
your judgement of whether the difference is large enough to matter clinically.
Statistical parity difference
The statistical parity difference is P(positive prediction | group A) minus P(positive prediction | group B). A value of 0 means both groups are flagged at the same rate. No clinically validated threshold tells you which difference is acceptable. Decide in advance, with clinicians and patient representatives, which size of difference would make you act, and read the measure together with the true and false positive rates of each group. A difference in flag rates can be correct if the groups really differ in how often they develop the condition.
Reporting
Report every fairness analysis you planned, including those that found no difference. Leaving out unfavourable subgroup results misleads readers in the same way as leaving out unfavourable accuracy results.
- Lekadir, K., Frangi, A. F., Porras, A. R., & others. (2025). FUTURE-AI: international consensus guideline for trustworthy and deployable artificial intelligence in healthcare. BMJ, 388, e081554. 10.1136/bmj-2024-081554
- European Parliament and Council. (2024). Regulation (EU) 2024/1689 of the European Parliament and of the Council on artificial intelligence. Official Journal of the European Union.